
AI in education · knowledge graphs · personalized learning
Offering every student exercises that are just right
A student who is given exercises that are too easy learns nothing; one who gets exercises that are too hard gives up. What is just right differs from student to student. To offer it, a system has to know two things: what is in a student's head, and which skills and facts an exercise needs. My group builds models of both, learns them from the data that students produce, and tests in classrooms whether the resulting personalized practice leads to better results.
Step 1 · Skills, exercises and a knowledge graph
Which exercise is just right for this student?
Every exercise needs a set of skills; in the table, the dark chips are the skills each one requires. A student who has to use all the required skills succeeds only if they master every one. Move the sliders to set how likely this student is to have mastered each skill, and the table shows the expected score on every exercise. On the right, the same exercises form a knowledge graph: an arrow runs from an exercise to one that needs everything it needs plus something more. Click a row to see the calculation.
The thresholds are illustrative. In a real system the "just right" zone is chosen from what is known about learning, and it can differ per learner and per goal.
Step 2 · Learning the structure from data
Nobody has to draw the graph: it can be found in the scores
Writing down by hand which skills each exercise needs does not scale, and experts often disagree. Instead, the system starts from a table of (student, exercise, score) and looks for the skill structure (the "Q-matrix") that explains it best. Each exercise gets a vector x with, per skill, the probability that the skill is needed. Each student gets a vector s with the probability that the skill is mastered. The expected score of a student on an exercise is the product, over skills, of 1 − x + x·s, so a skill that is not needed (x = 0) never matters, and a needed one (x = 1) counts as much as the student's s. Gradient descent adjusts all vectors to minimise the squared difference between actual and expected scores.
Scores
Each row is a student, each column an exercise; dark = correct.
What the system has learned
The answer it should find
A toy world where the answer is known, with a few percent random slips and guesses in the scores. The system never sees the skill names; columns are matched to names afterwards only for display. It works here because the set of exercises includes some that test a single skill on their own; without such exercises, different skill structures can explain the same scores equally well. Real data sets are much larger and messier.
Step 3 · In the classroom
From model to personalized practice
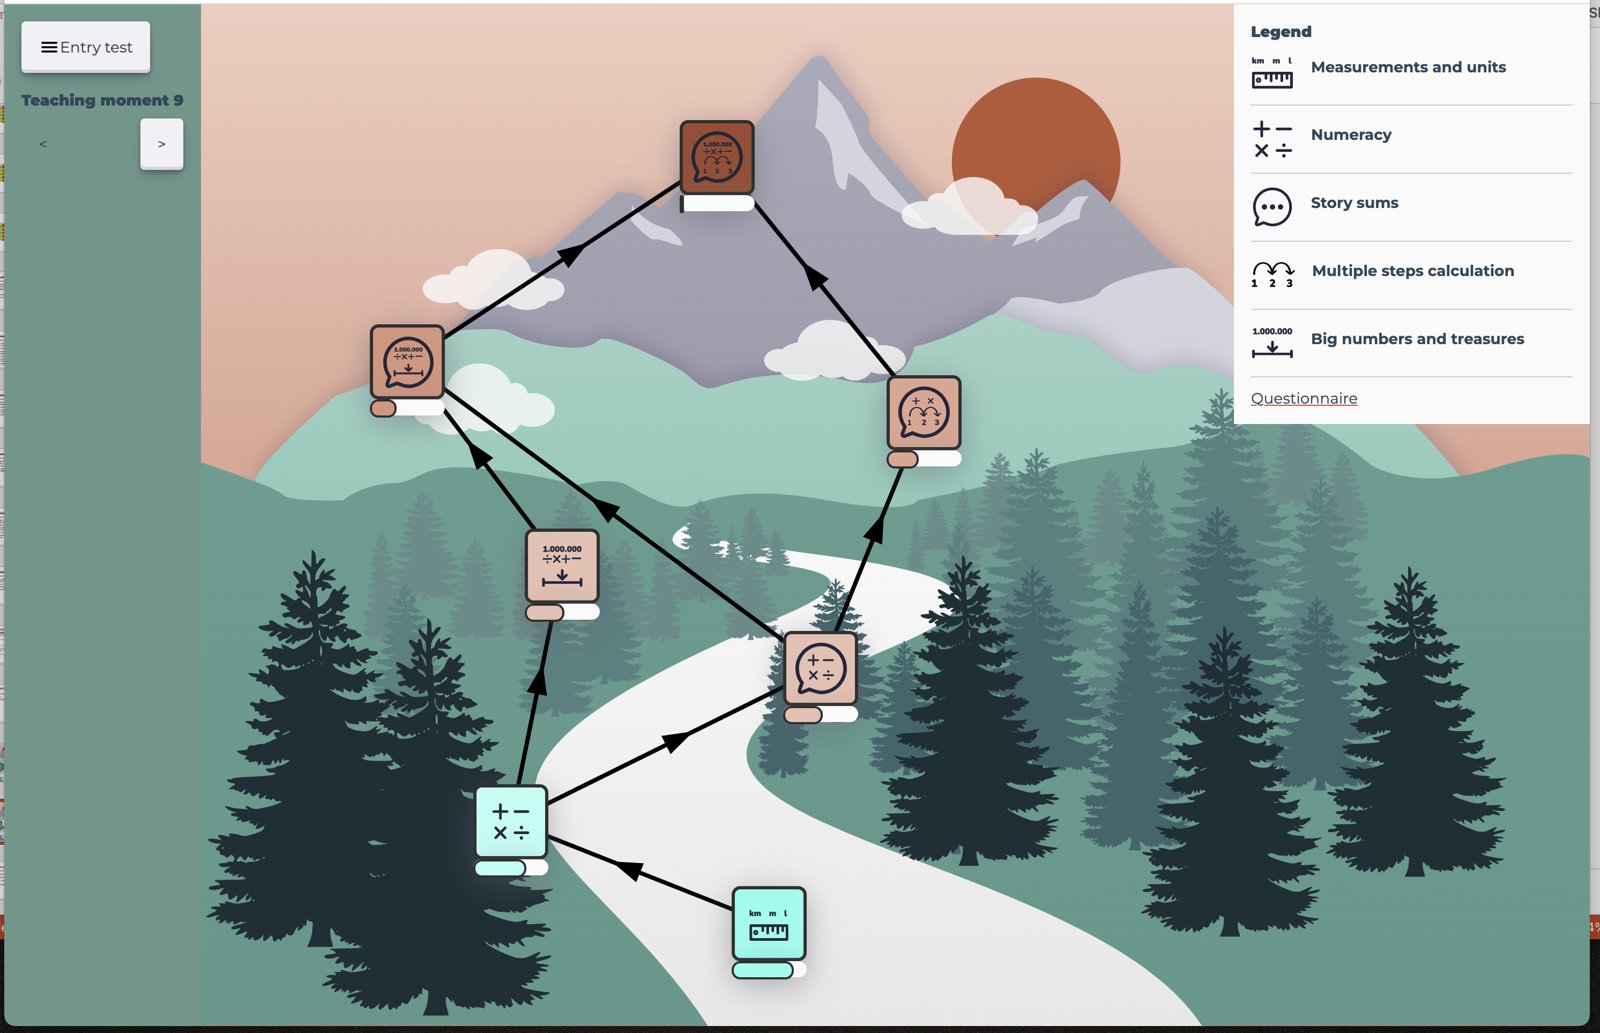
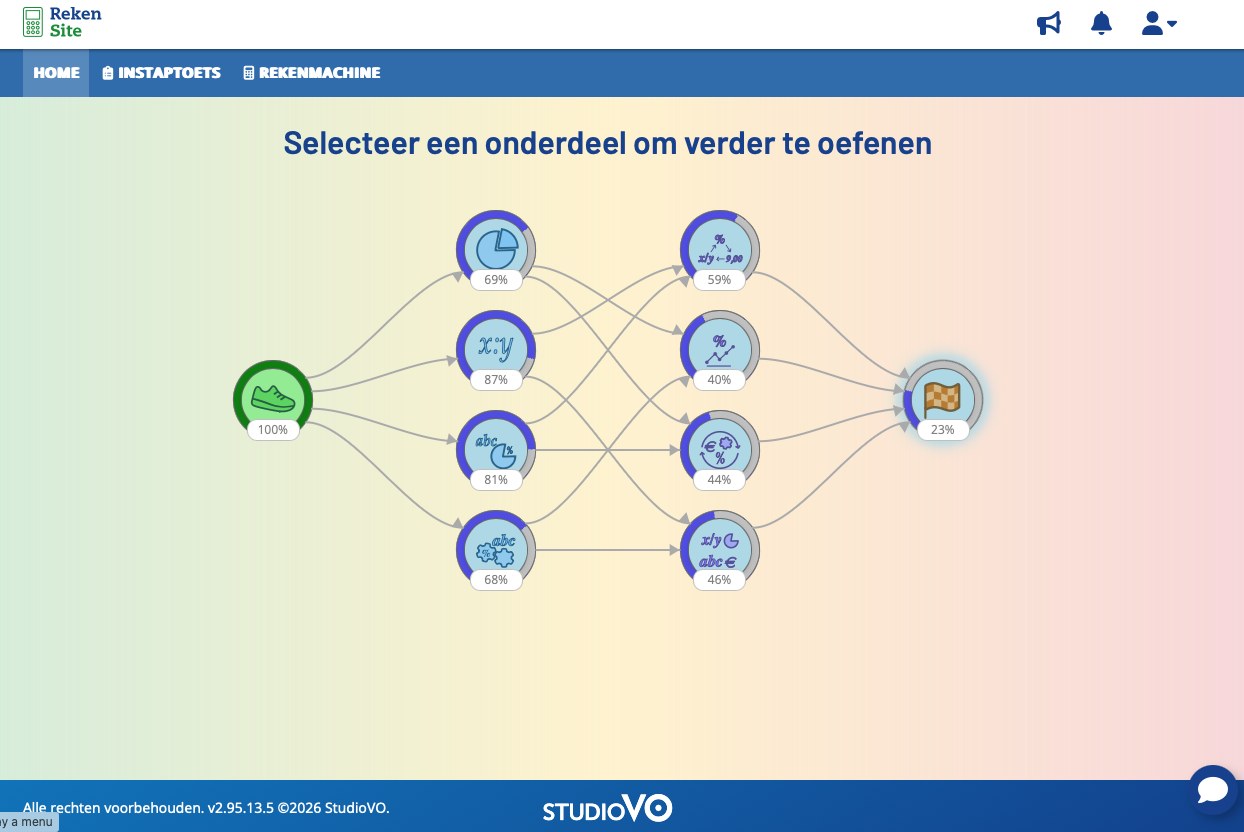
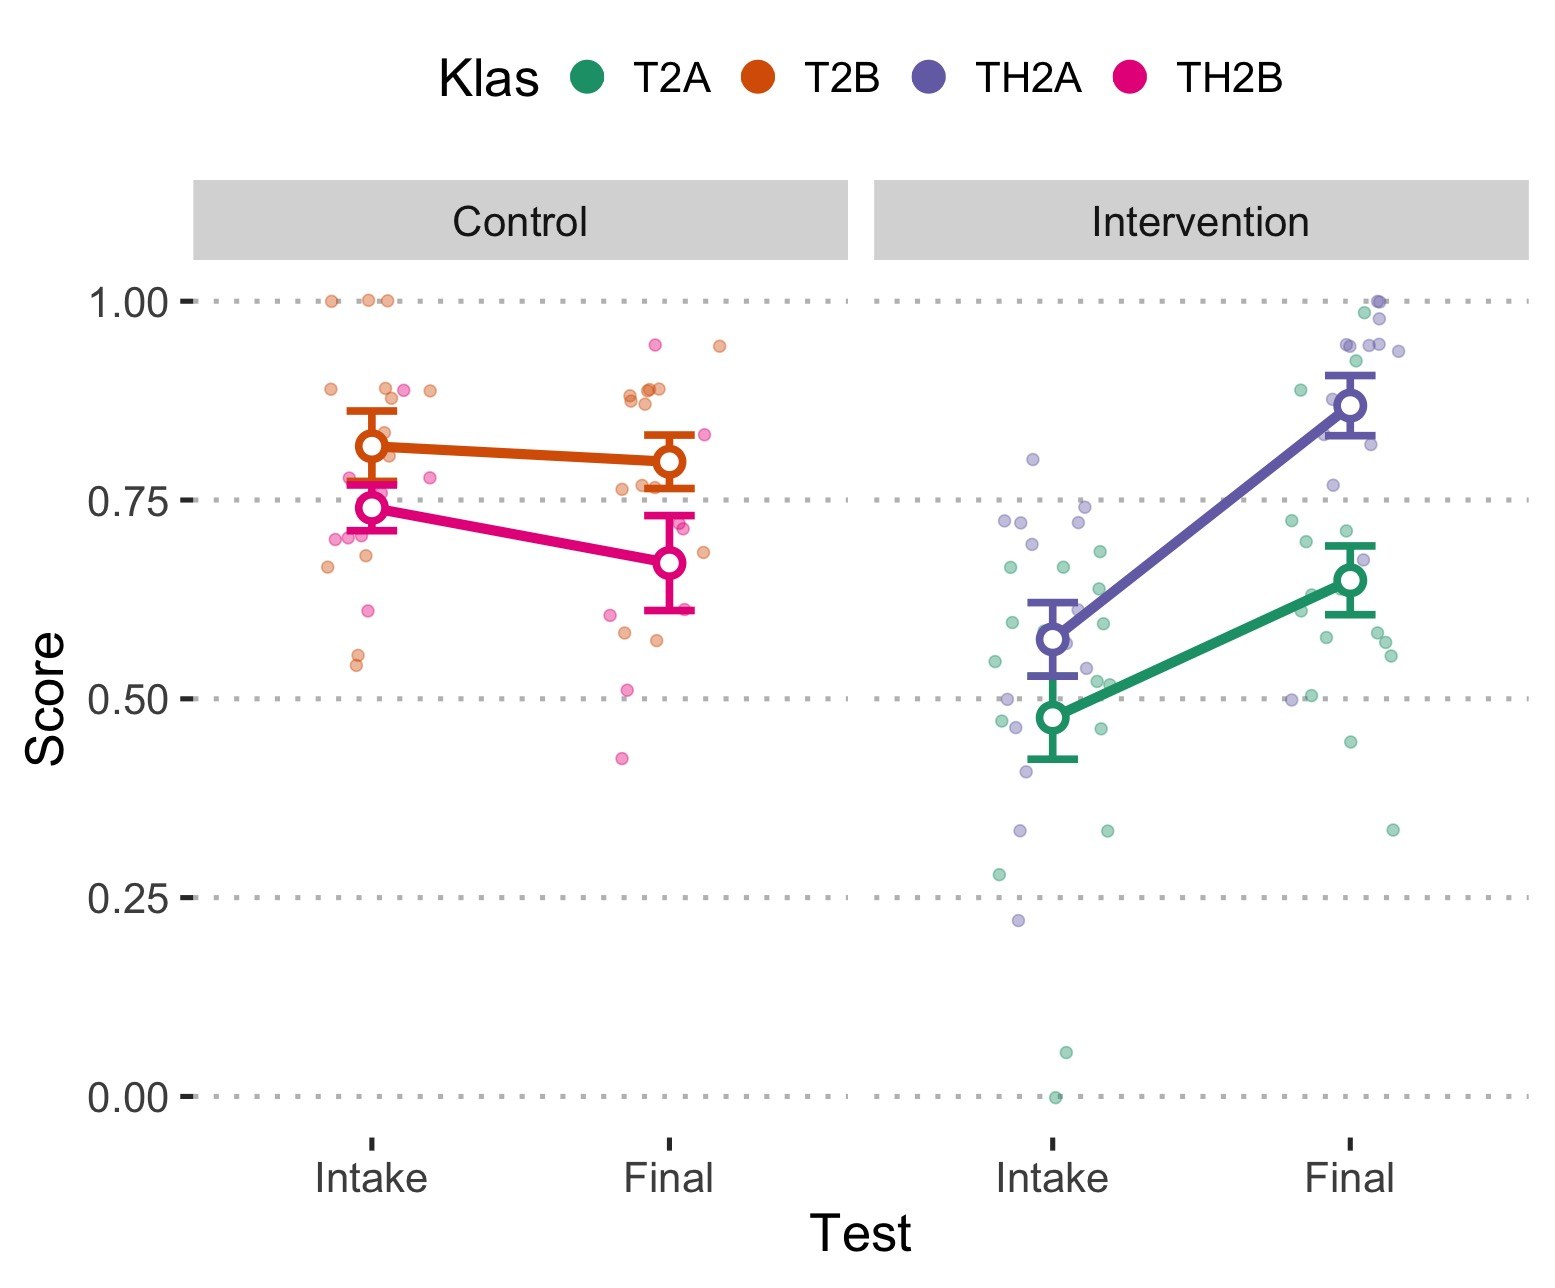
The same machinery can be applied to real exercise banks. The knowledge graph becomes a map that students move through: the system estimates what each student has mastered and suggests the next exercises on the edge of what they can do. Together with schools and with the Dutch National Education Lab AI (NOLAI), we study whether this helps.
Current projects
- Learning fractions and percentages
- Language understanding and following instructions
- Calculus in Science and Engineering
The work started with a pilot on data-driven knowledge models ("Data-gedreven kennismodellen"), funded within a Dutch AI and education programme (NLAIC and OCW, 2023), and continues in NOLAI projects on personalized learning of percentages and on improving reading skills in practical assignments. The longer-term aim is a foundation model for education, a general model of knowledge and learners that can serve many subjects.
I teach this material in the Master's course AI in Education.

Further reading
Related
Publications on this work are listed on my RUG research portal page. The underlying idea of explaining performance through reusable skills links to my work on PRIMs and transfer. See also the research overview.